Across horizons
Across the horizons the market shapes itself. A line through time. Today is steep. Tomorrow — who knows. We call the shape term structure.
A single implied-volatility number is insufficient: no single \(\sigma\) prices the entire options chain, because options at different expiries trade at different IVs. The pattern of IV across expiries is the term structure, and its slope is one of the most reliable regime signals available in options markets.
Plotting the curve
Pull ATM IVs across expiries (1 week, 2 weeks, 1 month, 3 months, 6 months, 1 year) on the S&P 500. In quiet markets, the curve is upward-sloping (contango). In crises, the short end spikes above the long end (backwardation):
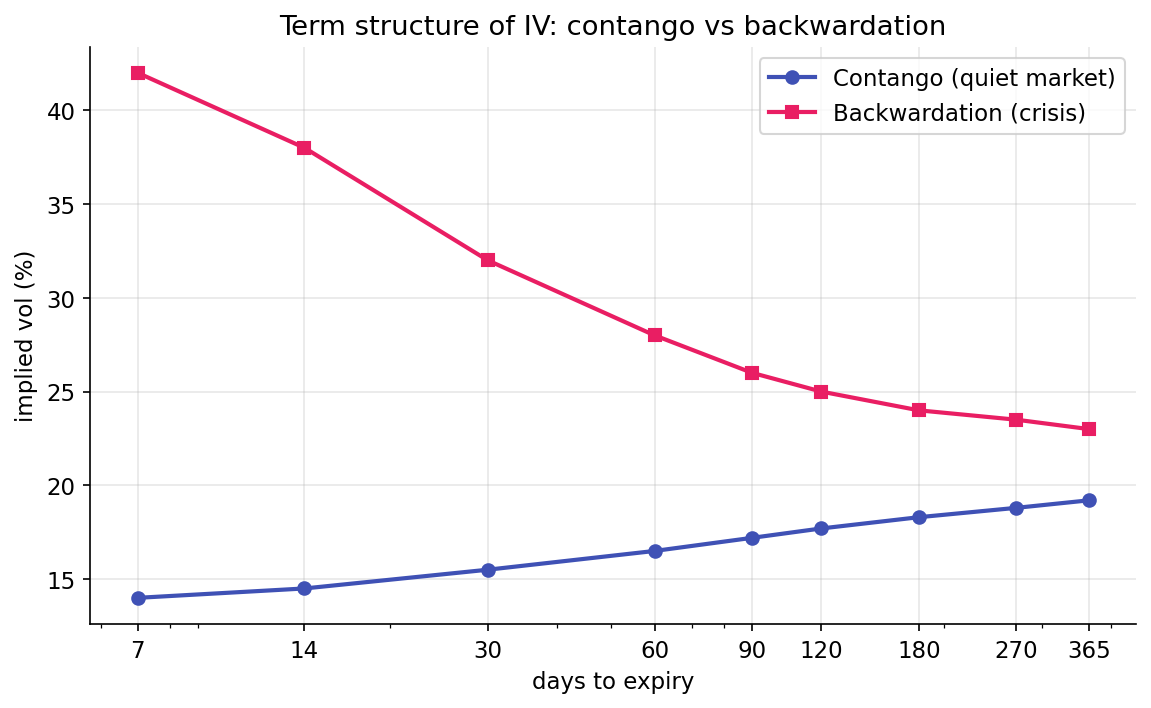
Contango is the normal state: longer horizons price higher uncertainty, and the variance risk premium is typically larger in absolute terms over longer expiries. Backwardation is a crisis marker: short-term uncertainty becomes high enough that near-dated options trade at higher IV than far-dated ones, because longer horizons carry an implicit belief in mean reversion and thus do not track the short-term spike.
The slope moves quickly. Mean reversion is slow.
The VIX family
CBOE publishes IV indices at specific maturities on the S&P 500:
| Index | Horizon |
|---|---|
| VIX9D | 9 days |
| VIX | 30 days |
| VIX3M | 3 months |
| VIX6M | 6 months |
Each uses the model-free variance-swap formula from the previous lesson, scaled to its target horizon. Two most-watched ratios:
- \(\text{VIX9D} / \text{VIX}\) — short-end slope. Above 1 indicates intraday panic pricing above 30-day IV.
- \(\text{VIX} / \text{VIX3M}\) — medium slope. Above 1 means 30-day IV exceeds 3-month IV, the most commonly referenced backwardation indicator.
In contango, both ratios are below 1. Inversion pushes one or both above 1.
Inversion as regime signal
When the short end stands above the long end, dealers are short gamma, realized volatility rises, trends follow through more often. The inversion is the footprint of panic-hedging flow.
Empirically, inverted term structure correlates with:
- Short-gamma dealer positioning (Part V) — the hedging feedback loop that amplifies moves.
- Higher realized volatility in the following days.
- Lower mean-reversion — trends that would normally reverse show more follow-through.
The underlying mechanism: demand for short-dated protection (puts expiring this week) is most elastic during acute stress. Customers buy puts; dealers sell them; the implied vol on those puts rises sharply, inverting the short end. The long end moves less — buyers do not panic-hedge year-out exposure — and the slope flips.
The signal is noisy. VIX/VIX3M occasionally crosses 1.0 on minor blips and reverts within hours. The persistence matters as much as the presence.
Thresholds and noise tolerance
A raw threshold at exactly 1.0 is noisy: small rounding errors, stale data, and intraday feed synchronization issues can push a ratio fractionally above 1.0 without a meaningful regime change. A small buffer reduces false triggers:
A 2% cushion. Not a theoretical number. A calibration. On a cleaner data source one might drop to 1.01; on a noisier one, raise to 1.03. The value sits above unity by enough to ignore measurement error, below the stress-signal levels.
Rolling z-scores
Absolute slope levels are not the only useful signal. "The short end is inverted" is one observation; "the short end inverted for the first time in six months" is a different, often sharper, signal. A rolling z-score captures the second form:
A large positive \(z\) indicates the slope is unusually high relative to its trailing year, which can flag regime shifts before the raw threshold is crossed.
Term structure versus VIX level
VIX high and contango — elevated volatility expected to persist. Still ordered.
VIX high and inverted — acute short-term stress, expected to mean-revert. The shape says what the level cannot.
Both observations matter in practice. The regime classifier uses shape (inversion) as a trigger for the vol_inverted regime; level is not an explicit trigger but indirectly affects position sizing in any strategy that scales by vol.
The full surface
Term structure is one axis. The other is strike. IV also varies across strikes at a single expiry. We call that skew. Both are departures from Black-Scholes' constant-\(\sigma\) assumption. Both are tradable.
The trading project consumes two summary statistics from term structure: the two slopes and the inversion flag. The full surface contains additional information, but the regime classifier is intentionally simple.
Summary
- A single "IV" number conceals surface structure; slope across expiries can carry the signal when the level does not.
- Contango is the normal state; backwardation correlates with short-gamma regimes and high realized volatility.
- Thresholds like 1.02 appear in regime rules because noise tolerance is a calibration decision.
Implemented at
trading/packages/gex/src/gex/termstructure.py:
- Line 23:
compute_term_structure(vix9d, vix, vix3m)returns the two slopes and inversion flag for a single EOD snapshot. - Line 39:
rolling_inversion_flags(series, lookback_days=252)builds the ratios across history with 252-day rolling z-scores. Output columns:short_slope,med_slope,short_slope_z,med_slope_z,is_inverted.
regime.py::classify_regime consumes these via short_slope and med_slope and uses a 1.02 inversion threshold to trigger the vol_inverted regime tag.
Across horizons, the market shapes. Across strikes, it does too — asymmetrically. Next: the skew.
Next: Fear is not symmetric →